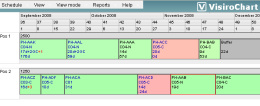
VisiroChart: Visualising Schedules
The VisiroChart is a software module that helps visualising complex schedules and allows making manipulations directly in the chart and to review the effect of the proposed changes within seconds.
Thereby, the VisiroChart is perfectly suited for any planning or scheduling problem that requires scenario comparison and analysis.
VisiroChart can be used for a wide range of applications, including maintenance planning, workforce planning or the creation of flight schedules.
The VisiroChart Concept
Discussions about plans or schedules typically revolve around what if questions. The VisiroChart helps answering these questions: after manipulating the schedule directly in the chart (just drag & drop), the VisiroChart will analyze all consequences and visualise any problems - within seconds!
Possible applications
The VisiroChart can be used in many situations, for example:
- Maintenance Facility Planning: scheduling maintenance checks in the hangar
- Ground Engineer Planning: optimise work schedules for ground engineers
- Flight schedule creation
- And many more...
For any business process that involves planning, scheduling or rostering, the VisiroChart concept proves to be useful.
Automated schedule generation
VisiroChart can be extended with functionalities for automated schedule generation or rostering. Read more on the subject on the page automated scheduling.
More information
If you want more information and if you want to know how the VisiroChart can help your organisation, please contact us.
For developers
The VisiroChart is developed in C# and ASP.NET and can be used as an interface to any .NET application. Additionally, the VisiroChart can be used directly with Novulo software. The VisiroChart module can be licensed to use with your own applications, for more information please contact us.
Maintenance Facility Planning
Save more than 10% on your total maintenance costs by using Visiro's Maintenance Facility Planning application. Read more

Contact us
For more information, please contact us.

©2008 Visiro, Utrecht, The Netherlands